
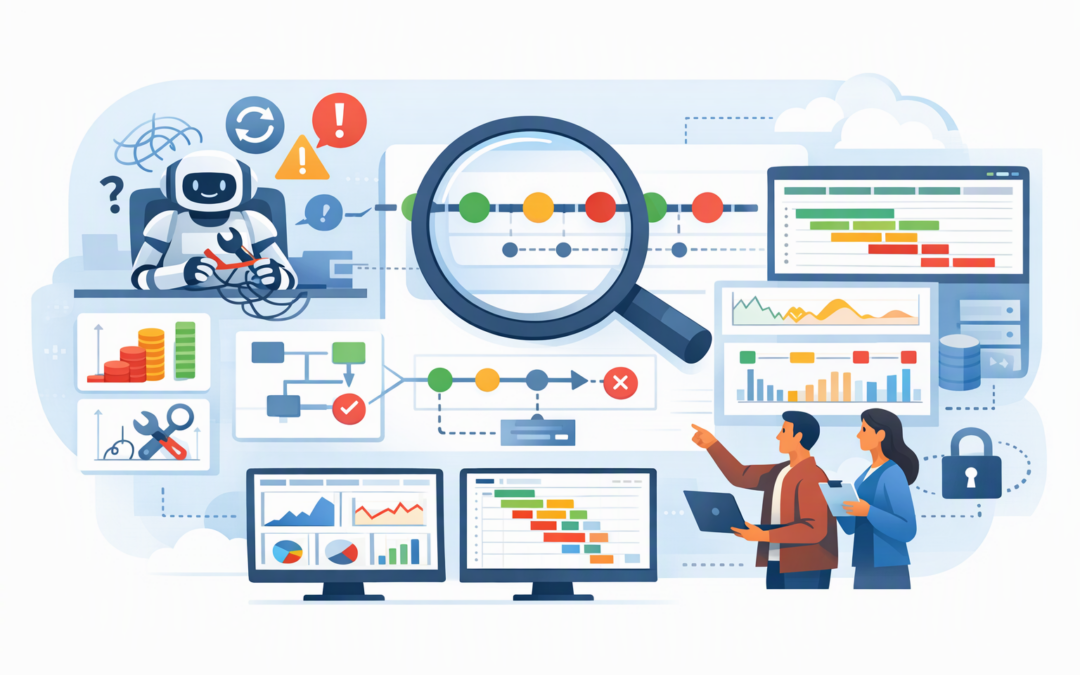
In this blog post Observability for AI Agents with Azure Monitor and OpenTelemetry we will explain how to see what your AI agents are doing, why they fail and where money is being spent before small issues become expensive operational problems.
An AI agent can appear healthy while quietly producing poor results. It may answer users, call business systems and complete requests, yet still choose the wrong tool, repeat the same step or consume far more AI capacity than expected.
Observability gives you a structured record of that journey. Instead of only knowing that a request succeeded or failed, you can see each model call, tool action, delay, retry and outcome that contributed to the result.
What AI agent observability actually means
Traditional application monitoring usually focuses on availability, errors and response times. Those measurements remain important, but they do not tell you whether an AI agent made a sensible decision.
CPI Consulting helps organisations design, build and secure Azure AI solutions, from Azure OpenAI and Microsoft Foundry to agents, governance and production deployment.
Visit CPI ConsultingAn agent might be technically available while giving customers incorrect information. It might complete a task successfully after making six unnecessary model calls, turning a low-cost interaction into an expensive one.
OpenTelemetry is an open standard for collecting operational information from applications. It records requests as traces, with each trace containing smaller steps called spans.
For an AI agent, a trace could include:
- The user request and the agent that received it.
- The AI model selected to process the request.
- Documents or knowledge sources searched.
- Tools, APIs or business systems called by the agent.
- Retries, errors and policy checks.
- Input and output token usage, which influences AI consumption costs.
- The final result and whether the business task was completed.
OpenTelemetry GenAI conventions provide common labels for this information. That consistency matters because it lets Azure Monitor understand telemetry from different agent frameworks without every development team inventing its own monitoring format.
How Azure Monitor fits into the picture
Azure Monitor is Microsoft’s platform for collecting, analysing and alerting on operational data. Application Insights, a capability within Azure Monitor, stores application traces and helps teams investigate individual transactions.
When an agent is connected correctly, OpenTelemetry collects the activity and sends it to Application Insights. Your team can then move from a high-level dashboard into the detailed trace for a specific failed, slow or unusually expensive request.
For agents hosted in Microsoft Foundry, server-side tracing may provide useful visibility with minimal code changes. Client-side instrumentation can then be added around custom business logic, external services and steps that occur outside the hosted agent.
This complements the service-level monitoring covered in our guide to monitoring Azure AI services. Service monitoring tells you whether the platform is healthy. Agent tracing tells you what happened inside an individual workflow.
A simple tracing pattern
The following Python example configures Azure Monitor and creates a span around a support process. The span adds business context without recording the customer’s full message.
import os
from azure.monitor.opentelemetry import configure_azure_monitor
from opentelemetry import trace
from opentelemetry.trace import Status, StatusCode

configure_azure_monitor(
 connection_string=os.environ[
 "APPLICATIONINSIGHTS_CONNECTION_STRING"
 ]
)

tracer = trace.get_tracer("customer-service-agent")

with tracer.start_as_current_span("process-support-request") as span:
 span.set_attribute("gen_ai.agent.name", "support-agent")
 span.set_attribute("gen_ai.agent.version", "2026-11")
 span.set_attribute("business.process", "customer-support")

 try:
 result = run_support_agent()
 span.set_attribute("business.outcome", "completed")
 except Exception as error:
 span.record_exception(error)
 span.set_status(Status)
 raise
Framework instrumentation can create the more detailed spans for model calls and tool activity. The custom span above connects those technical steps to the process the business actually cares about.
That distinction is important. A dashboard showing 99.9 per cent availability means little if only 70 per cent of customer requests reach an acceptable outcome.
The measurements leaders should insist on
Business completion rate
Measure whether the agent completed its assigned task, not simply whether it returned an answer. For example, did it actually update the customer record, create the order or route the request correctly?
Response time by step
Separate time spent waiting for the model from time spent searching documents or calling business systems. This prevents teams from upgrading an AI model when the real bottleneck is an outdated internal application.
Token usage and estimated cost
Track consumption by agent, version, department and business process. Sudden increases can reveal overly long prompts, repeated calls, unnecessary conversation history or agents stuck in retry loops.
Tool success and retry rates
An agent may depend on a CRM, finance platform or internal database. Monitoring each tool call shows which integration is causing failures and whether the agent is responding safely when a system becomes unavailable.
Quality and safety results
Operational success does not guarantee a useful answer. Production monitoring should therefore include approved quality evaluations, policy failures and escalation rates alongside technical performance.
Multi-agent environments need an additional layer because one agent may pass work to several others. Our article on monitoring agent-to-agent communication in Azure explains how to follow those hand-offs without losing the original business context.
A practical 200-person business scenario
Consider a 200-person company introducing an agent to classify support requests, search internal documentation and create tickets. Staff initially report that the agent feels slow, while finance notices that monthly AI consumption is higher than forecast.
A trace reveals that the agent searches the same document source three times before creating each ticket. It also sends the entire conversation history to the model at every step.
The agent is not technically broken. Every request eventually succeeds, so a standard uptime dashboard shows no obvious problem.
After removing the repeated search and limiting unnecessary conversation history, the company reduces response time and AI consumption without changing models. Observability turns a vague complaint into a specific, measurable fix.
Do not turn tracing into a privacy problem
Detailed traces can contain prompts, responses, customer information, tool arguments and retrieved documents. Collecting everything by default can create unnecessary exposure under Australian privacy obligations and contractual confidentiality requirements.
Start with metadata such as timing, token counts, agent versions, tool names and outcomes. Capture full content only when there is a clear troubleshooting or audit need, with access controls, redaction and appropriate retention settings.
Restrict access through Azure roles and review who can read the connected Application Insights and Log Analytics data. Sampling and retention rules can also prevent telemetry costs from growing without limit.
Security teams can extend this operational view into threat detection. We cover that next step in wiring AI agent telemetry into Microsoft Sentinel, which can identify unusual tool use, prompt injection attempts and suspicious data access.
A sensible rollout plan
- Choose one important workflow. Avoid trying to monitor every AI experiment at once.
- Define the business outcome. Decide what successful completion means before building dashboards.
- Connect Application Insights. Confirm traces are arriving and can be followed from the initial request to the final result.
- Add business context. Record safe labels such as department, workflow, agent version and outcome.
- Create meaningful alerts. Start with failure rates, unusual latency, retry loops and unexpected token growth.
- Test privacy controls. Confirm that prompts, credentials and personal information are not being collected unintentionally.
- Review after every release. Compare agent versions so you can quickly detect higher costs or lower completion rates.
Some agent monitoring features and framework integrations may still be offered as previews. Check their current production support, limitations and service commitments before making them critical to your operating model.
Make the agent accountable to the business
Good observability is not about creating more dashboards. It is about answering practical questions: Is the agent completing useful work, what is each outcome costing, where are failures occurring and can we prove what happened?
CloudPro Inc combines more than 20 years of enterprise IT experience with hands-on expertise across Azure, Microsoft 365, OpenAI, Claude, Defender and Wiz. As a Melbourne-based Microsoft Partner and Wiz Security Integrator, we help organisations build monitoring that is useful to technical teams and understandable to business leaders.
If your AI agents are already operating but you cannot clearly explain their cost, behaviour or business results, we are happy to review the current setup and identify the visibility gaps — no strings attached.