
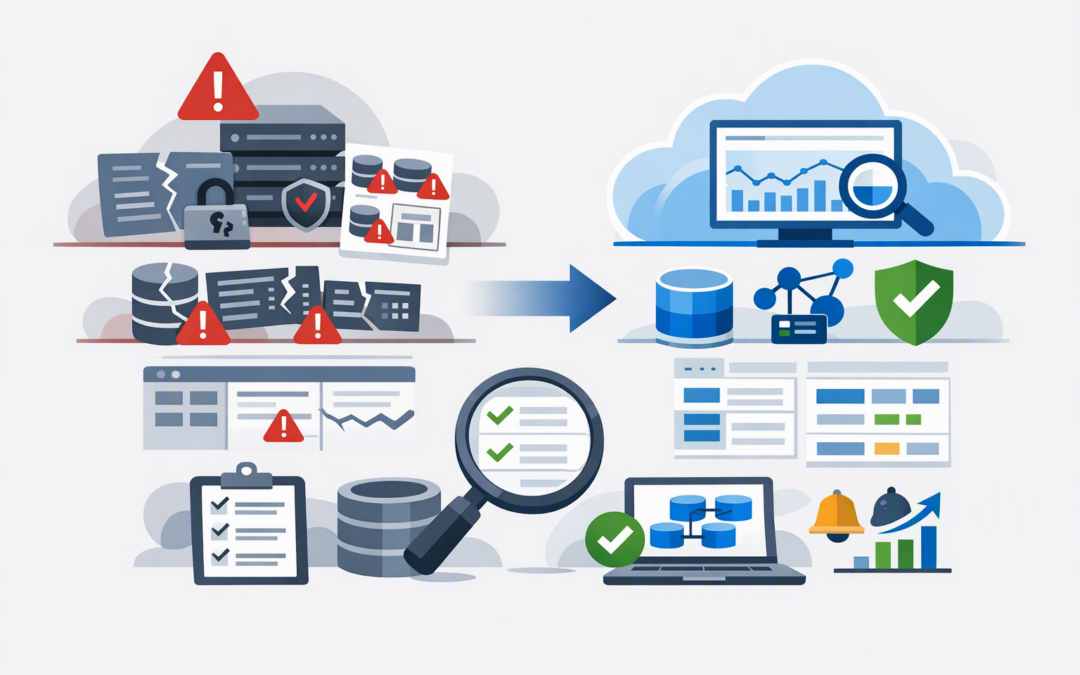
In this blog post Azure Container Apps Logging Migration to Azure Monitor Safely we will explain how to move away from the legacy logging path without losing operational visibility, breaking alerts or creating an unexpected monitoring bill. If your team assumes this is simply a setting change, you may discover the problem only when an application fails and the expected logs are missing.
At a high level, Azure Container Apps is a Microsoft service for running packaged applications without managing the underlying servers. Azure Monitor is Microsoft’s central monitoring service, which collects operational information and routes it to destinations such as a Log Analytics workspace, an archive or another security platform.
The migration changes how Container Apps sends its logs into that monitoring system. Your applications will usually continue writing messages in the same way, but the tables, queries, dashboards and alerts used by your IT team may need to change.
Why this migration now needs attention
The legacy Log Analytics destination for Azure Container Apps uses Microsoft’s older HTTP Data Collector API. Support for that API ended on 14 September 2026.
CPI Consulting helps organisations design, build and secure Azure AI solutions, from Azure OpenAI and Microsoft Foundry to agents, governance and production deployment.
Visit CPI ConsultingThis does not mean every existing logging connection stopped working on that date. Microsoft has said ingestion can continue for compliant connections, but the legacy API is now on a limited support path that receives only critical security fixes.
For business leaders, the risk is straightforward. An unsupported monitoring dependency can become a blind spot during an outage, security investigation or customer incident.
The safer long-term model is to select Azure Monitor as the environment’s logging destination and use diagnostic settings. Diagnostic settings are routing rules that specify which logs to collect and where to send them.
Understand what changes before touching production
Under the legacy model, application console logs and Container Apps system logs are written to custom tables named ContainerAppConsoleLogs_CL and ContainerAppSystemLogs_CL. The _CL suffix identifies them as custom log tables.
After moving to Azure Monitor, new records use resource-specific tables such as ContainerAppConsoleLogs and ContainerAppSystemLogs. Column names also lose suffixes such as _s.
That small naming change can break saved searches, alert rules, dashboards, workbooks and automated reports. Historical records are not automatically copied into the new tables, even if you continue using the same Log Analytics workspace.
This is why the migration should be treated as an operational change rather than a portal housekeeping task.
1. Find every dependency on the old tables
Start by creating an inventory of every Container Apps environment. Confirm which environments still use the legacy Log Analytics destination and which business services depend on them.
Then search for references to the old table names across:
- Azure Monitor alert rules
- Operational dashboards and Azure Workbooks
- Saved Log Analytics queries
- Microsoft Sentinel security detections
- Support team troubleshooting guides
- Scripts, reports and external monitoring tools
- Cost and usage reports
Pay particular attention to alerts that notify staff about failed deployments, container crashes, volume mount errors or unavailable revisions. A migration can appear successful while these alerts quietly stop working.
This inventory supports the broader monitoring approach discussed in operating Azure application platforms with fewer costly blind spots.
2. Decide where each type of log should go
Azure Monitor gives you more routing flexibility than the legacy connection. Logs can be sent to a Log Analytics workspace for investigation, an Azure Storage account for lower-cost archiving, an Event Hub for forwarding to another platform, or a supported partner monitoring service.
You do not need to send everything everywhere. That usually creates duplicate data and unnecessary charges.
A practical design might keep recent console and system logs in Log Analytics, archive selected records for longer retention, and forward security-relevant events to the organisation’s central security platform.
Also decide whether you need HTTP logs, which record requests passing through the application’s web entry point. They can be valuable for diagnosing slow requests and errors, but high-traffic applications may generate substantial data.
This is the point to estimate daily log volume, retention periods and ingestion costs. Our guide to Azure Monitor advanced metrics explains how monitoring data can support earlier cost decisions rather than simply adding to the monthly bill.
3. Prepare new queries before the change
Do not wait until the change window to rewrite your queries. Build and review the new versions first, then keep a clear mapping between the old and new tables.
A basic legacy console log query may look like this:
ContainerAppConsoleLogs_CL
| where TimeGenerated > ago(30m)
| order by TimeGenerated desc
| take 100
The equivalent query for records routed through Azure Monitor starts with the new table:
ContainerAppConsoleLogs
| where TimeGenerated > ago(30m)
| order by TimeGenerated desc
| take 100
Queries that reference individual fields need additional updates. For example, Log_s becomes Log, while ContainerAppName_s becomes ContainerAppName.
Keep the old queries available for historical investigations. If teams regularly need to search across the migration date, create a shared workspace function that presents old and new records through one consistent view.
4. Run a controlled migration
Choose a lower-risk environment first. A development or test environment with realistic traffic gives the team an opportunity to validate the process before production.
- Confirm that the Microsoft.Insights resource provider is registered.
- Check that the migration team can update the Container Apps environment and create diagnostic settings.
- Record the existing workspace details and credentials needed for rollback.
- Change the environment’s logging destination to Azure Monitor.
- Immediately create the diagnostic setting and explicitly select the required destination.
- Generate known application, system and HTTP events.
- Confirm that new records appear in the expected tables.
Azure Monitor does not automatically preserve the old workspace association. Even when you plan to use the same workspace, you must select it in the new diagnostic setting.
Logs can also take several minutes to become searchable. Use the Container Apps live log stream when you need immediate output during testing, rather than treating a short ingestion delay as a failure.
5. Validate business monitoring, not just data ingestion
Seeing records in a table is only the first test. Run each important alert, dashboard and support procedure against the new data path.
Consider a 200-person company whose customer portal runs on several container apps. The infrastructure team confirms that console logs are arriving, but a revenue-impacting deployment alert still queries the old system table.
The next failed revision is visible to an engineer who happens to check manually, but no notification reaches the service desk. The migration worked technically while failing operationally.
A proper validation should confirm:
- Logs arrive from every important app, revision and container.
- System events such as deployment failures remain visible.
- Alerts reach the correct people and escalation channels.
- Dashboards show current rather than historical-only data.
- Security tools receive the expected events.
- Retention and archive policies match business requirements.
- Daily ingestion remains within the approved cost range.
Important exceptions and governance checks
Azure Monitor is currently unavailable as a logging destination for Azure Container Apps Express environments. Identify the environment type before scheduling the change rather than assuming the same process applies everywhere.
You should also review whether application logs contain personal information, access tokens, customer records or confidential prompts from AI services. Logging sensitive data can create privacy and security exposure even when the monitoring platform itself is correctly configured.
For Australian organisations, reliable logging supports incident investigation, audit evidence and security operations associated with the Essential 8, the Australian Government’s baseline cybersecurity framework. Logging is not a substitute for implementing those controls, but poor records make it harder to prove what happened and respond quickly.
If your Container Apps host AI workloads, align the migration with the practices in our guide to monitoring Azure AI services. AI applications often require additional controls around prompt content, model errors, response times and usage costs.
The outcome should be better monitoring, not merely newer plumbing
A well-planned migration reduces the risk of unsupported logging, keeps outage alerts working and provides clearer control over where monitoring data is stored. It can also lower costs by separating searchable operational data from records that only need long-term archiving.
CloudProInc combines more than 20 years of enterprise IT experience with practical Azure delivery. As a Melbourne-based Microsoft Partner and Wiz Security Integrator, we help organisations connect application monitoring, cloud security and cost governance without turning the project into a giant consulting exercise.
If you are unsure whether your Container Apps environments still use the legacy logging path, or whether your current alerts will survive the move, we are happy to review the setup and give you a practical migration plan with no strings attached.